集群变红却无节点宕机?记一次 OpenSearch 独立数据盘触及低水位线的“隐形”故障复盘#
摘要#
在基于冷热分离(Hot-Warm)架构的 SIEM 日志平台运维中,存储管理往往是决定集群稳定性的“隐形生命线”。本篇博客记录了一起典型的“非破坏性”故障:集群所有物理节点均在线,但状态却突变为 RED。经过深度排查,根因锁定为历史日志未及时下沉,导致热节点独立数据盘触及低水位线(Low Watermark)阈值,进而引发副本分片无法分配。本文将完整梳理从告警发现、API 精准诊断到组合拳治理的全过程,并沉淀出 SIEM 架构的长效避坑指南。
一、故障发现:诡异的“全员存活,集群变红”#
1. 监控面板的异常信号#
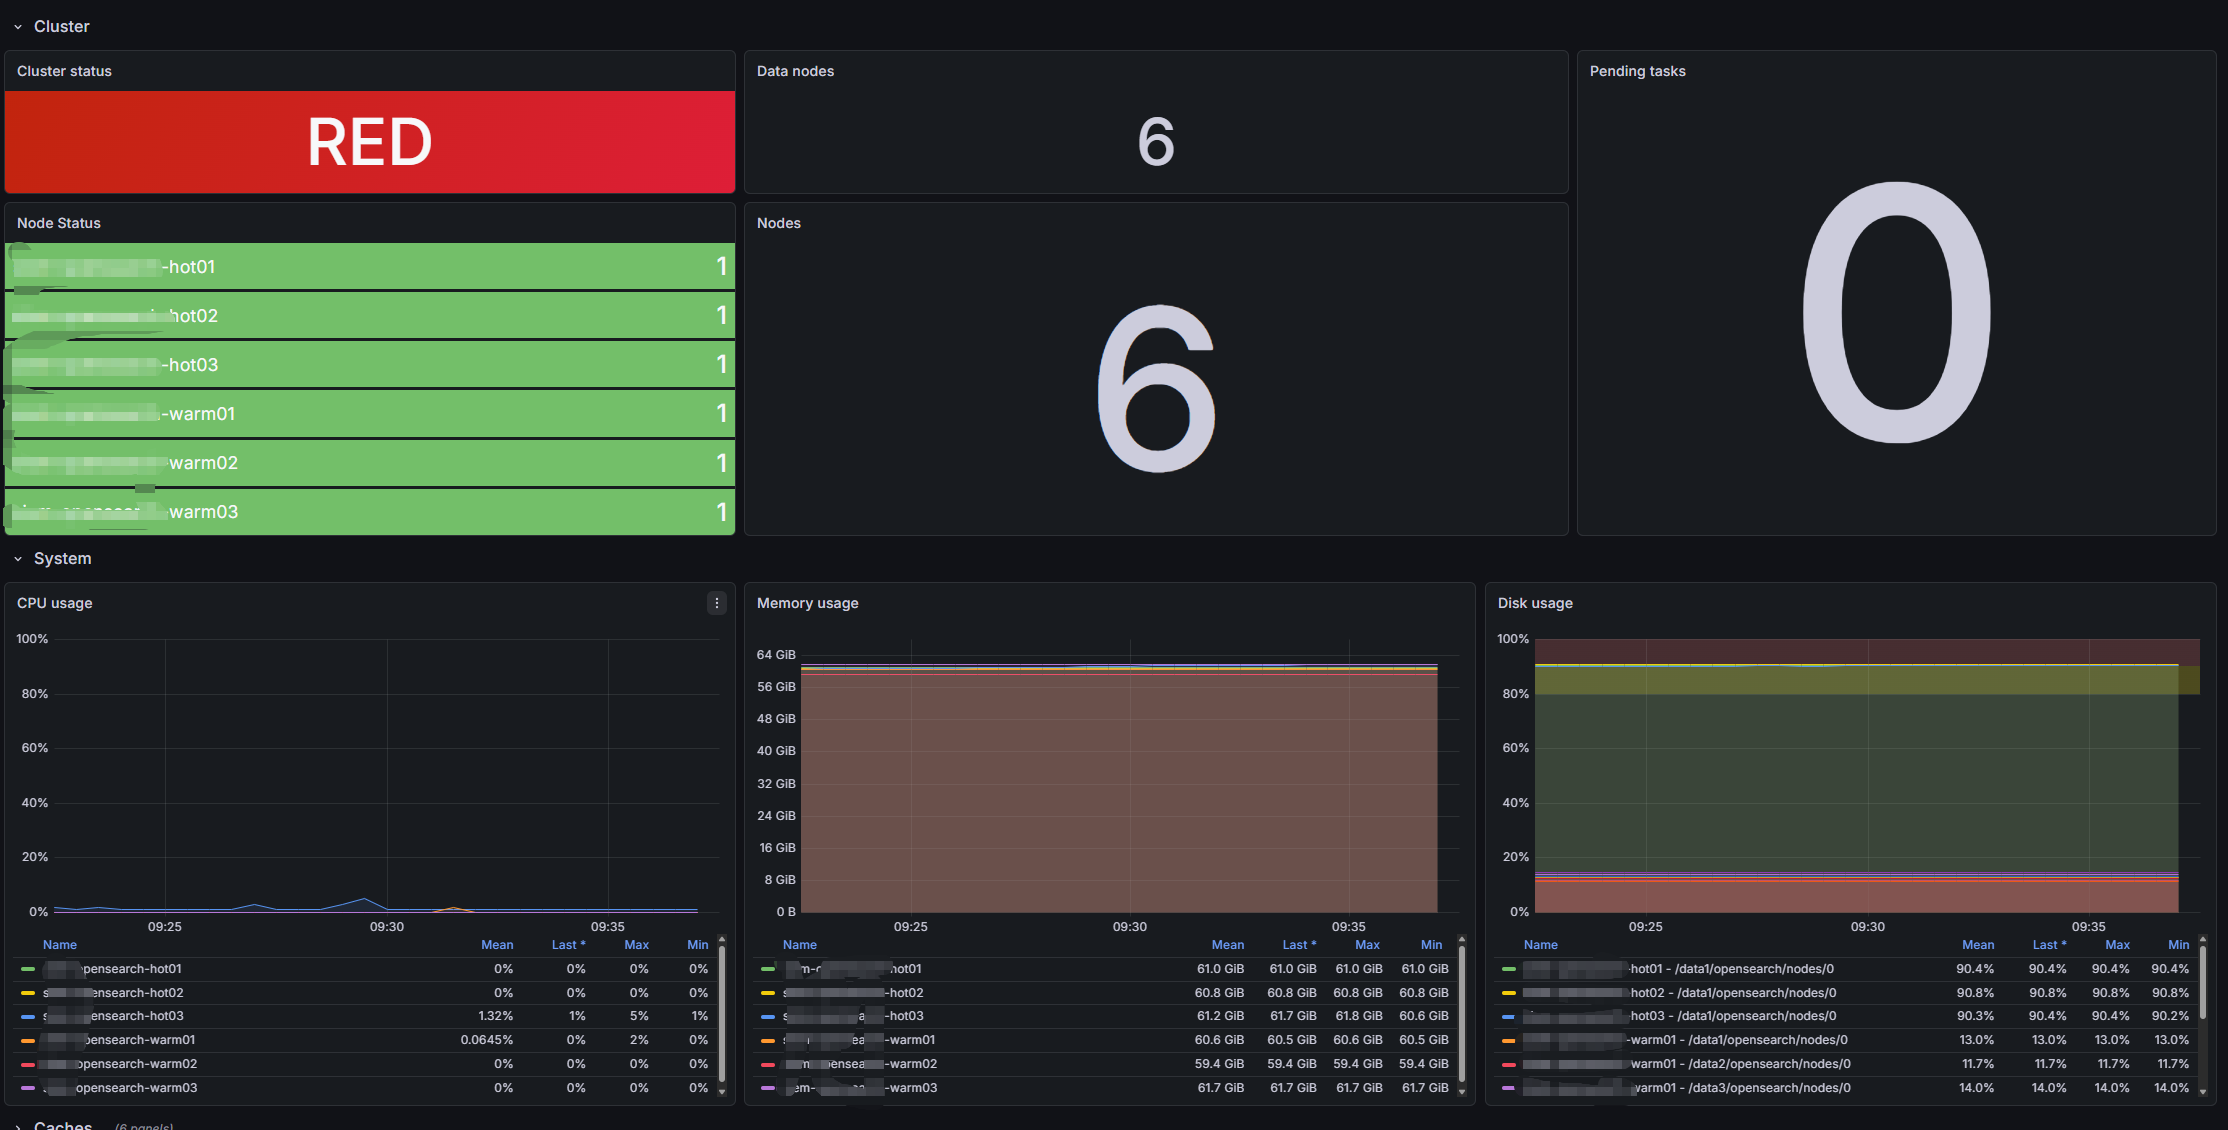
通过 Grafana 监控面板,运维团队在巡检时捕获到以下异常:
- Cluster Status:处于最高级别的 RED 状态。
- Node Status:集群内 6 个节点(3 个
hot热节点,3 个warm暖节点)的进程存活且没有积压的 Pending tasks。
2. 异常原因分析#
但是从下面的 CPU、内存和磁盘可以看出集群状态变红的原因所在:
Disk Usage监控指标可以看存储,所有hot节点的磁盘使用率均超过 90%, 但是warm节点的磁盘使用率仅为12%左右。
在opensearch 当中默认的磁盘低水位线是85%,默认的高水平线是90%。
low watermark当某个节点的磁盘使用率达到该阈值时,OpenSearch 将停止向该节点分配新的分片。这一限制不会影响新创建索引的主分片(Primary Shards),主分片依然可以正常落在此节点上。它阻止的仅仅是副本分片(Replica Shards)的分配。high watermark这是一个硬性限制,当某个节点的磁盘使用率达到该阈值时,它会影响所有分片(包括主分片和副本分片)的分配。一旦节点磁盘突破此线,任何新分片都无法再分配进来。同时,OpenSearch 会启动自动保护机制,尝试将该节点上现有的分片主动迁移(Relocate)到其他磁盘利用率较低的节点上。
- 内存处于高位且 CPU 空闲。所有节点的 Memory Usage 几乎处于平线状态,维持在 60 GiB ~ 61 GiB 的极高位置(接近 64 GiB 满配)。而 CPU 使用率几乎为 0%。
- 当前已经分配32GB内存给JVM并且开启了内存锁定,剩下的接近30G内存被Linux系统的Page Cache占用。
- CPU使用率极低,证明集群当前并没有因为内存不足发生GC或者OOM。如果真的是内存导致的集群异常,通常会看到CPU因为频发GC而导致的使用率飙升或者节点直接离线。
基于以上分析,查看集群当前水位线:
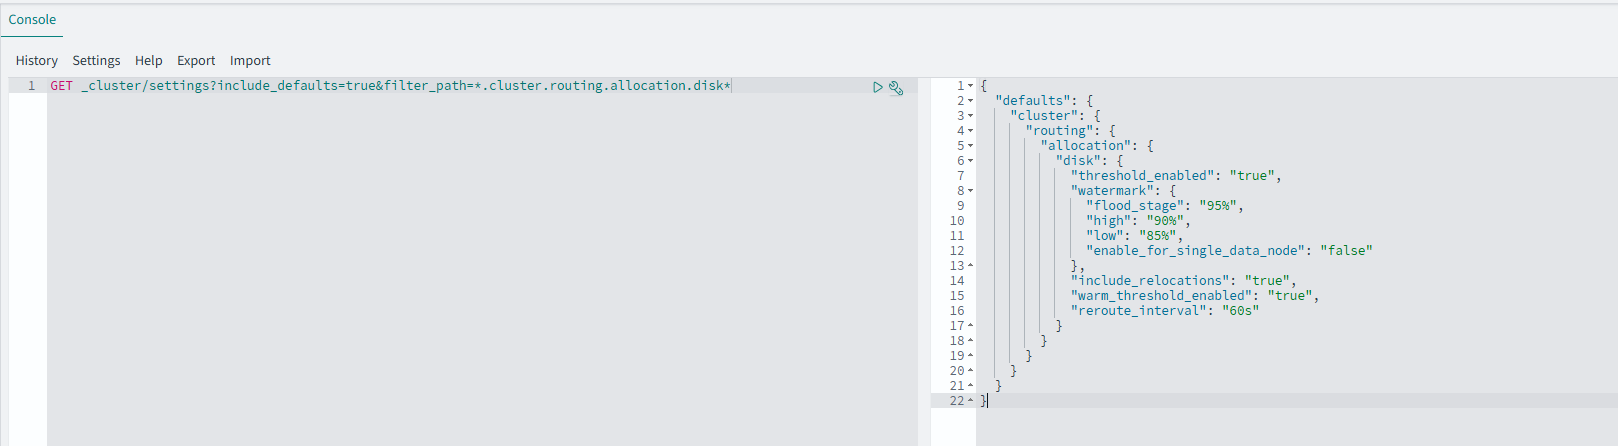
当前集群的水位线和分析的一样都是默认的阈值。
通过监控我们已经锁定了热节点的磁盘危机。然而,为了避免‘头痛医头’的盲目介入,我们必须穿透指标层,进入集群的底层路由调度队列。 下面通过调用集群的 Allocation Explain API,对处于卡死状态的具体索引进行‘法医级’解剖
️ 二、深度诊断:Allocation Explain API 的“法医级”解剖#
我们知道必然存在未分配的分片,但此时我们并不知道具体是哪一个索引触发了死锁。为了避免盲目排查,我们首先执行了分片状态摸排命令,通过过滤 UNASSIGNED 状态来寻找线索:
GET _cat/shards?v&h=index,shard,prirep,state,unassigned.reason&s=state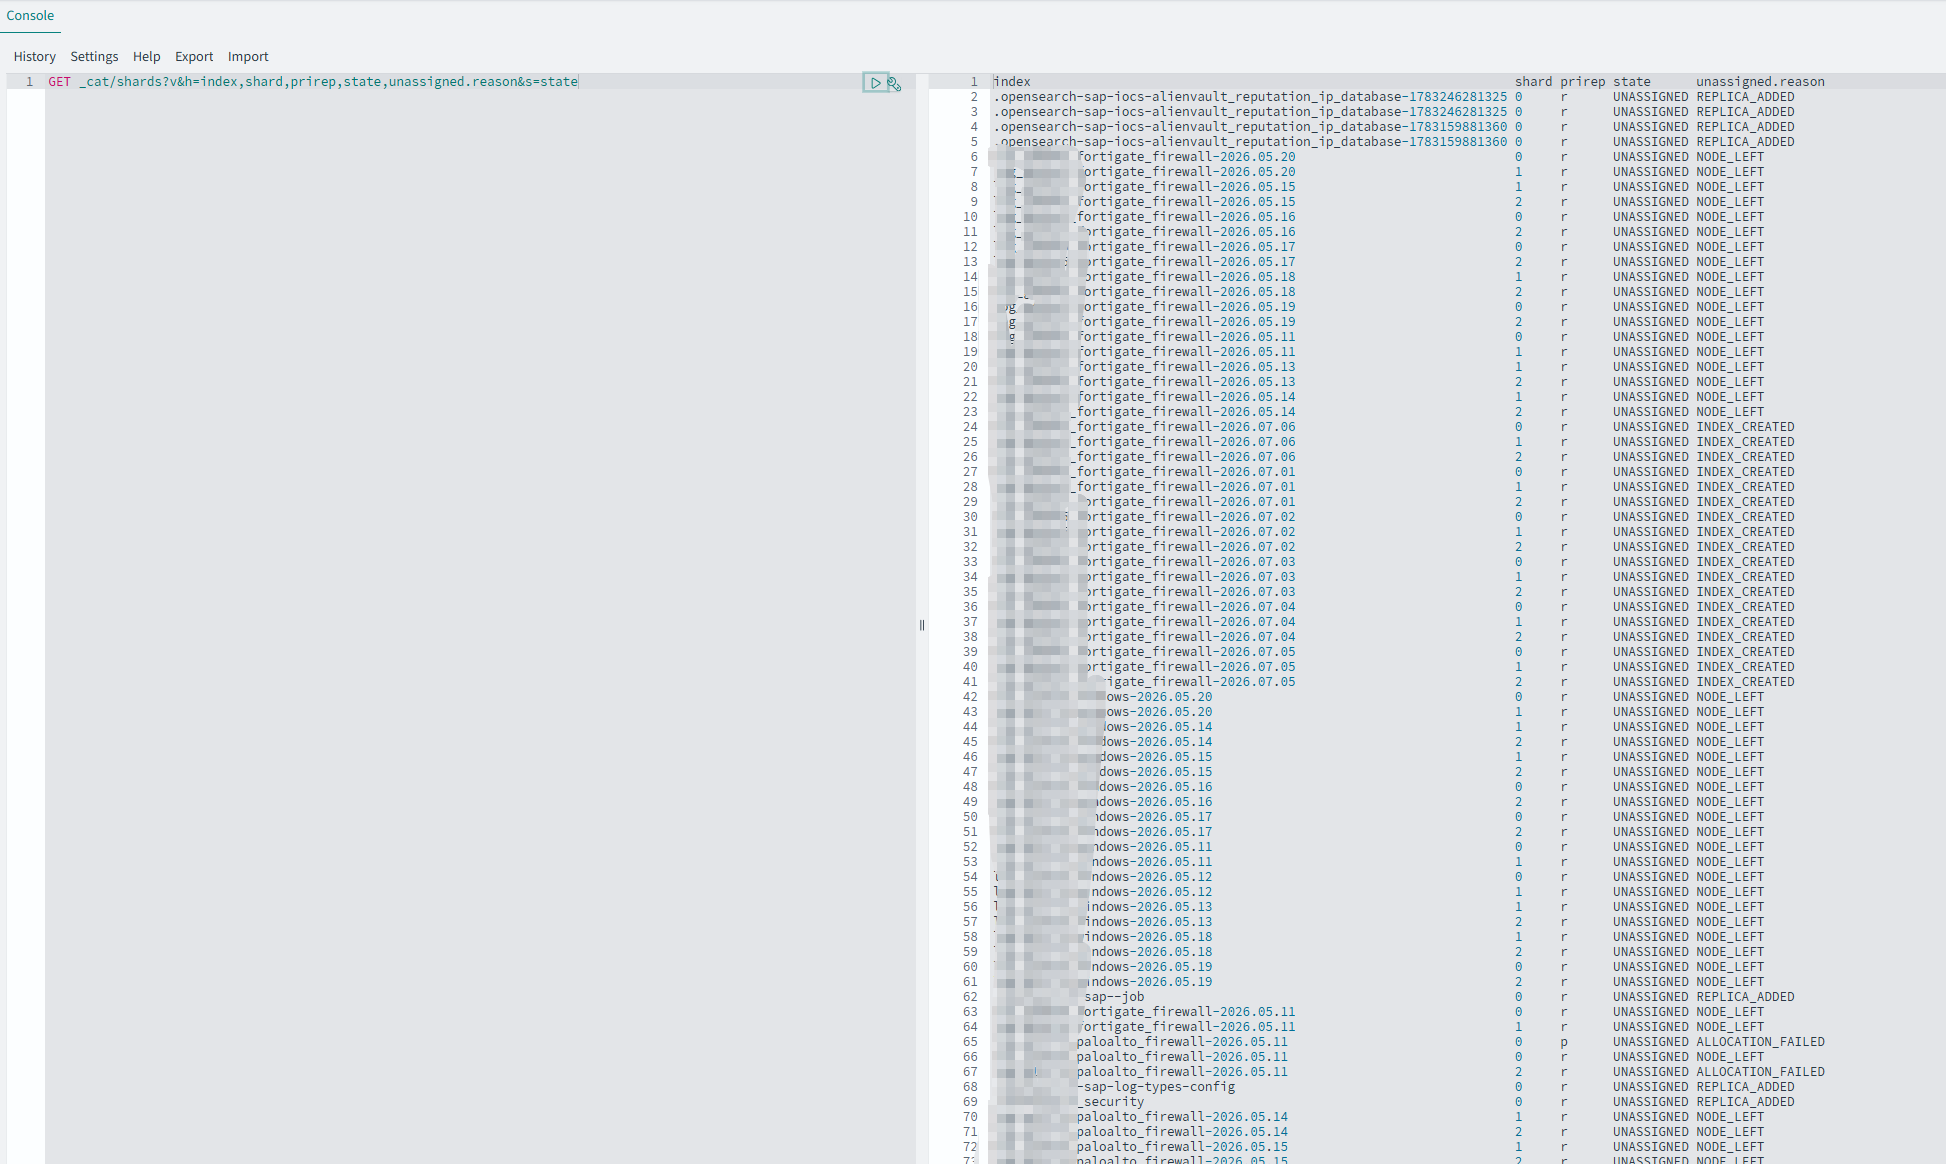
上述异常索引中我们以 .opensearch-sap-iocs-alienvault_reputation_ip_database-1783246281325 为例调用集群分配解释器(Allocation Explain API)对卡住的原因进行精准诊断:
- 查询主分片(Primary Shard)的分配状态
POST _cluster/allocation/explain
{
  "index": ".opensearch-sap-iocs-alienvault_reputation_ip_database-1783246281325",
  "shard": 0,
  "primary": true
}
返回结果如下:
{
  "index": ".opensearch-sap-iocs-alienvault_reputation_ip_database-1783246281325",
  "shard": 0,
  "primary": true,
  "current_state": "started",
  "current_node": {
    "id": "UqSkVG_xT_2HR2p66yXR-w",
    "name": "opensearch-hot03",
    "transport_address": "192.168.91.36:9300",
    "attributes": {
      "temp": "hot",
      "shard_indexing_pressure_enabled": "true"
    }
  },
  "can_remain_on_current_node": "no",
  "can_remain_decisions": [
    {
      "decider": "disk_threshold",
      "decision": "NO",
      "explanation": "the shard cannot remain on this node because it is above the high watermark cluster setting [cluster.routing.allocation.disk.watermark.high=90%] and there is less than the required [10.0%] free disk on node, actual free: [9.314286695240694%]"
    }
  ],
  "can_move_to_other_node": "no",
  "move_explanation": "cannot move shard to another node, even though it is not allowed to remain on its current node",
  "node_allocation_decisions": [
    {
      "node_id": "GV_wW3FfRiuJrV6niqls_A",
      "node_name": "opensearch-hot01",
      "transport_address": "192.168.91.34:9300",
      "node_attributes": {
        "temp": "hot",
        "shard_indexing_pressure_enabled": "true"
      },
      "node_decision": "no",
      "weight_ranking": 1,
      "deciders": [
        {
          "decider": "disk_threshold",
          "decision": "NO",
          "explanation": "the node is above the low watermark cluster setting [cluster.routing.allocation.disk.watermark.low=85%], using more disk space than the maximum allowed [85.0%], actual free: [9.63155600136529%]"
        }
      ]
    },
    {
      "node_id": "9BRLhqhMSbWu2VBb_V6d_w",
      "node_name": "opensearch-hot02",
      "transport_address": "192.168.91.35:9300",
      "node_attributes": {
        "temp": "hot",
        "shard_indexing_pressure_enabled": "true"
      },
      "node_decision": "no",
      "weight_ranking": 2,
      "deciders": [
        {
          "decider": "disk_threshold",
          "decision": "NO",
          "explanation": "the node is above the low watermark cluster setting [cluster.routing.allocation.disk.watermark.low=85%], using more disk space than the maximum allowed [85.0%], actual free: [9.181377859157058%]"
        }
      ]
    },
    {
      "node_id": "3Y7RzLC2ScWHxS9960U-Ww",
      "node_name": "opensearch-warm01",
      "transport_address": "192.168.91.41:9300",
      "node_attributes": {
        "temp": "warm",
        "shard_indexing_pressure_enabled": "true"
      },
      "node_decision": "no",
      "weight_ranking": 3,
      "deciders": [
        {
          "decider": "same_shard",
          "decision": "NO",
          "explanation": "a copy of this shard is already allocated to this node [[.opensearch-sap-iocs-alienvault_reputation_ip_database-1783246281325][0], node[3Y7RzLC2ScWHxS9960U-Ww], [R], s[STARTED], a[id=ki7k0bH5TOugE7v2UiwPbw]]"
        }
      ]
    },
    {
      "node_id": "BCGvqoCZQtOhY8YmyeK9qg",
      "node_name": "opensearch-warm02",
      "transport_address": "192.168.91.42:9300",
      "node_attributes": {
        "temp": "warm",
        "shard_indexing_pressure_enabled": "true"
      },
      "node_decision": "no",
      "weight_ranking": 4,
      "deciders": [
        {
          "decider": "same_shard",
          "decision": "NO",
          "explanation": "a copy of this shard is already allocated to this node [[.opensearch-sap-iocs-alienvault_reputation_ip_database-1783246281325][0], node[BCGvqoCZQtOhY8YmyeK9qg], [R], s[STARTED], a[id=1SDvrjV9RhmvGOg38TqBNg]]"
        }
      ]
    },
    {
      "node_id": "Gk5fENqYTjSImfRwsgNCjQ",
      "node_name": "opensearch-warm03",
      "transport_address": "192.168.91.43:9300",
      "node_attributes": {
        "temp": "warm",
        "shard_indexing_pressure_enabled": "true"
      },
      "node_decision": "no",
      "weight_ranking": 5,
      "deciders": [
        {
          "decider": "same_shard",
          "decision": "NO",
          "explanation": "a copy of this shard is already allocated to this node [[.opensearch-sap-iocs-alienvault_reputation_ip_database-1783246281325][0], node[Gk5fENqYTjSImfRwsgNCjQ], [R], s[STARTED], a[id=7m5Ifa57TjGHkZPpu-k84Q]]"
        }
      ]
    }
  ]
}- 查询副本分片(Replica Shard)的分配状态
POST _cluster/allocation/explain
{
  "index": ".opensearch-sap-iocs-alienvault_reputation_ip_database-1783246281325",
  "shard": 0,
  "primary": false
}
返回结果如下:
{
  "index": ".opensearch-sap-iocs-alienvault_reputation_ip_database-1783246281325",
  "shard": 0,
  "primary": false,
  "current_state": "unassigned",
  "unassigned_info": {
    "reason": "REPLICA_ADDED",
    "at": "2026-07-05T10:11:21.338Z",
    "last_allocation_status": "no_attempt"
  },
  "can_allocate": "no",
  "allocate_explanation": "cannot allocate because allocation is not permitted to any of the nodes",
  "node_allocation_decisions": [
    {
      "node_id": "3Y7RzLC2ScWHxS9960U-Ww",
      "node_name": "opensearch-warm01",
      "transport_address": "192.168.91.41:9300",
      "node_attributes": {
        "temp": "warm",
        "shard_indexing_pressure_enabled": "true"
      },
      "node_decision": "no",
      "deciders": [
        {
          "decider": "same_shard",
          "decision": "NO",
          "explanation": "a copy of this shard is already allocated to this node [[.opensearch-sap-iocs-alienvault_reputation_ip_database-1783246281325][0], node[3Y7RzLC2ScWHxS9960U-Ww], [R], s[STARTED], a[id=ki7k0bH5TOugE7v2UiwPbw]]"
        }
      ]
    },
    {
      "node_id": "9BRLhqhMSbWu2VBb_V6d_w",
      "node_name": "opensearch-hot02",
      "transport_address": "192.168.91.35:9300",
      "node_attributes": {
        "temp": "hot",
        "shard_indexing_pressure_enabled": "true"
      },
      "node_decision": "no",
      "deciders": [
        {
          "decider": "disk_threshold",
          "decision": "NO",
          "explanation": "the node is above the low watermark cluster setting [cluster.routing.allocation.disk.watermark.low=85%], using more disk space than the maximum allowed [85.0%], actual free: [9.181377859157058%]"
        }
      ]
    },
    {
      "node_id": "BCGvqoCZQtOhY8YmyeK9qg",
      "node_name": "opensearch-warm02",
      "transport_address": "192.168.91.42:9300",
      "node_attributes": {
        "temp": "warm",
        "shard_indexing_pressure_enabled": "true"
      },
      "node_decision": "no",
      "deciders": [
        {
          "decider": "same_shard",
          "decision": "NO",
          "explanation": "a copy of this shard is already allocated to this node [[.opensearch-sap-iocs-alienvault_reputation_ip_database-1783246281325][0], node[BCGvqoCZQtOhY8YmyeK9qg], [R], s[STARTED], a[id=1SDvrjV9RhmvGOg38TqBNg]]"
        }
      ]
    },
    {
      "node_id": "GV_wW3FfRiuJrV6niqls_A",
      "node_name": "opensearch-hot01",
      "transport_address": "192.168.91.34:9300",
      "node_attributes": {
        "temp": "hot",
        "shard_indexing_pressure_enabled": "true"
      },
      "node_decision": "no",
      "deciders": [
        {
          "decider": "disk_threshold",
          "decision": "NO",
          "explanation": "the node is above the low watermark cluster setting [cluster.routing.allocation.disk.watermark.low=85%], using more disk space than the maximum allowed [85.0%], actual free: [9.63155600136529%]"
        }
      ]
    },
    {
      "node_id": "Gk5fENqYTjSImfRwsgNCjQ",
      "node_name": "opensearch-warm03",
      "transport_address": "192.168.91.43:9300",
      "node_attributes": {
        "temp": "warm",
        "shard_indexing_pressure_enabled": "true"
      },
      "node_decision": "no",
      "deciders": [
        {
          "decider": "same_shard",
          "decision": "NO",
          "explanation": "a copy of this shard is already allocated to this node [[.opensearch-sap-iocs-alienvault_reputation_ip_database-1783246281325][0], node[Gk5fENqYTjSImfRwsgNCjQ], [R], s[STARTED], a[id=7m5Ifa57TjGHkZPpu-k84Q]]"
        }
      ]
    },
    {
      "node_id": "UqSkVG_xT_2HR2p66yXR-w",
      "node_name": "opensearch-hot03",
      "transport_address": "192.168.91.36:9300",
      "node_attributes": {
        "temp": "hot",
        "shard_indexing_pressure_enabled": "true"
      },
      "node_decision": "no",
      "deciders": [
        {
          "decider": "same_shard",
          "decision": "NO",
          "explanation": "a copy of this shard is already allocated to this node [[.opensearch-sap-iocs-alienvault_reputation_ip_database-1783246281325][0], node[UqSkVG_xT_2HR2p66yXR-w], [P], s[STARTED], a[id=l0BNcfj5QYqKyYgKkoUXtA]]"
        },
        {
          "decider": "disk_threshold",
          "decision": "NO",
          "explanation": "the node is above the low watermark cluster setting [cluster.routing.allocation.disk.watermark.low=85%], using more disk space than the maximum allowed [85.0%], actual free: [9.278398009736396%]"
        }
      ]
    }
  ]
}
综合上述对指定索引主副分片的诊断,验证了之前对于故障原因的分析。
️ 三、故障解决#
当前的核心问题是热节点物理剩余空间(9.1%~9.6%)冲破了 85% 的低水位线,导致副本分配全面熔断。我们首先通过瞬态配置放宽红线。
步骤 1:临时抬高全局磁盘水位线(解除热区分配熔断)#
为了让卡住的副本分片立刻能够在剩余的热节点落盘,我们通过控制台临时将集群的数据盘低水位线阈值放宽至 95%,为集群重路由争取空间:
PUT _cluster/settings
{
  "transient": {
    "cluster.routing.allocation.disk.watermark.low": "95%",
    "cluster.routing.allocation.disk.watermark.high": "97%",
    "cluster.routing.allocation.disk.watermark.flood_stage": "99%"
  }
}- 执行完后,不需要等待,直接执行健康检查命令:
GET _cluster/health你会看到 unassigned_shards(未分配分片数)开始下降,意味着阻塞的路由队列已经通车,我们可以立刻执行第二步。
{
  "cluster_name": "cluster",
  "status": "red",
  "timed_out": false,
  "number_of_nodes": 6,
  "number_of_data_nodes": 6,
  "discovered_master": true,
  "discovered_cluster_manager": true,
  "active_primary_shards": 1246,
  "active_shards": 2408,
  "relocating_shards": 2,
  "initializing_shards": 13,
  "unassigned_shards": 113,
  "delayed_unassigned_shards": 0,
  "number_of_pending_tasks": 0,
  "number_of_in_flight_fetch": 0,
  "task_max_waiting_in_queue_millis": 0,
  "active_shards_percent_as_number": 95.02762430939227
}
步骤2: 手动将历史索引驱逐至 Warm节点#
- 执行定向强制下沉命令
PUT log_*-2026.05.*/_settings
{
  "index.routing.allocation.require.temp": "warm"
}

PUT log_*-2026.06.*/_settings
{
  "index.routing.allocation.require.temp": "warm"
}- 监控搬迁进度
GET _cat/recovery?active_only=true&detailed=true&v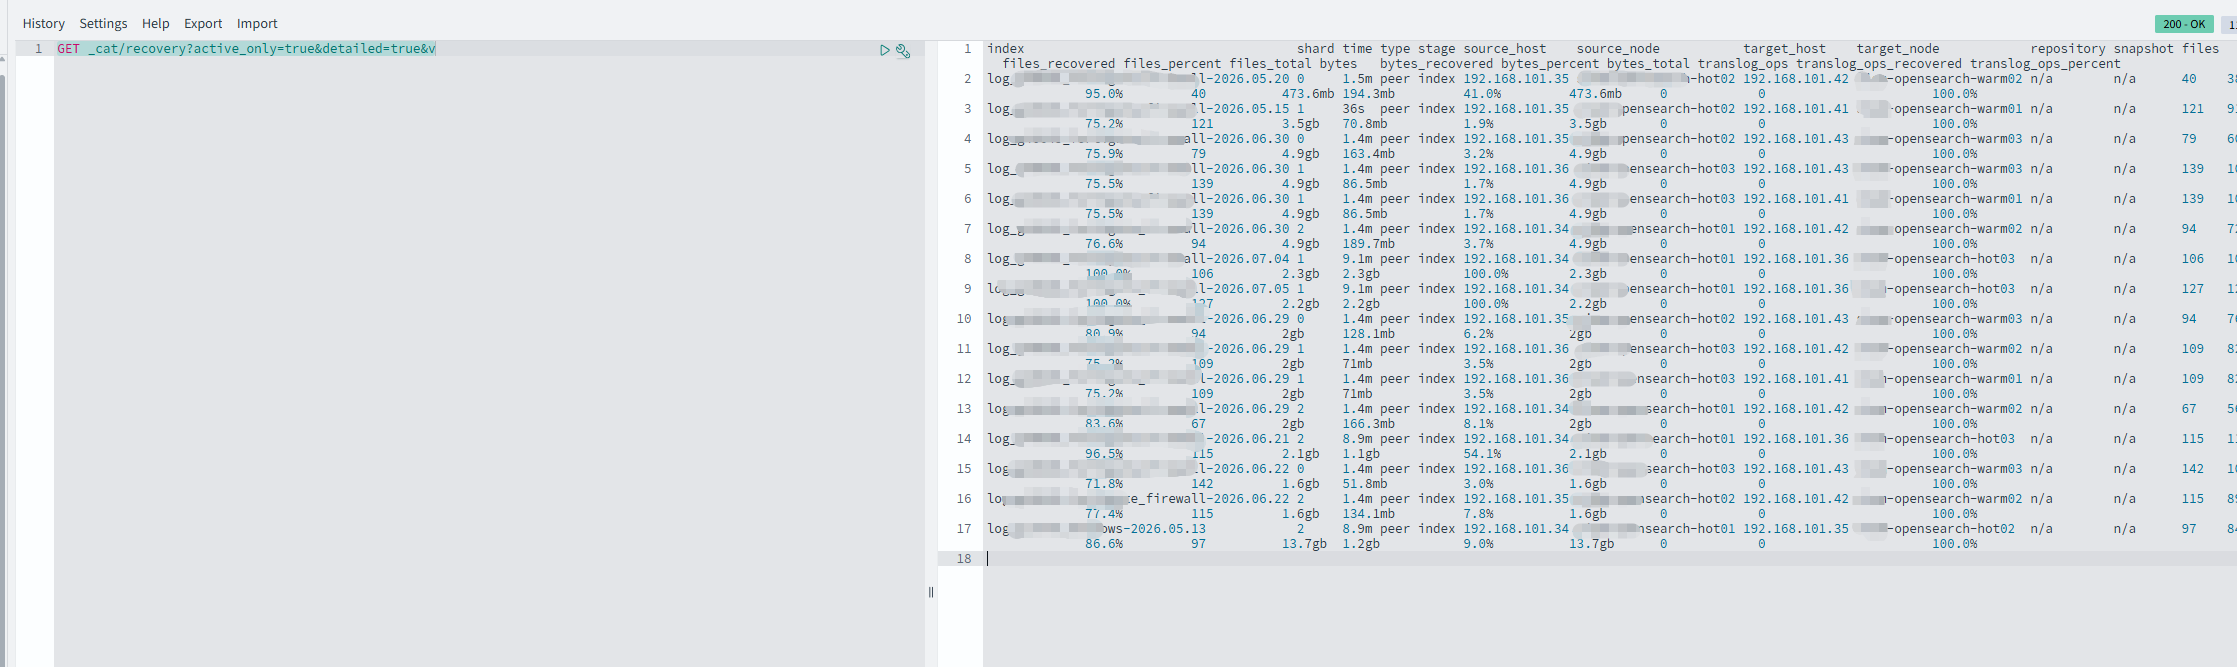
步骤3: 查看集群健康状态#
等待所有搬迁任务完成之后,检查集群健康状态,如果集群健康状态为 green,则说明故障已经解决。
GET _cluster/health{
"cluster_name": "cluster",
"status": "red",
"timed_out": false,
"number_of_nodes": 6,
"number_of_data_nodes": 6,
"discovered_master": true,
"discovered_cluster_manager": true,
"active_primary_shards": 1155,
"active_shards": 2349,
"relocating_shards": 0,
"initializing_shards": 0,
"unassigned_shards": 3,
"delayed_unassigned_shards": 0,
"number_of_pending_tasks": 0,
"number_of_in_flight_fetch": 0,
"task_max_waiting_in_queue_millis": 0,
"active_shards_percent_as_number": 99.87244897959184
}但是很不幸的是,即便如此 集群状态还是 red,从指标可以看到 relocating_shards 和 initializing_shards 都变为了 0, 但是还剩下 3 个 unassigned_shards。 这说明冷热迁移和绝大多数副本分片已经搬迁完毕了,但是为什么卡在最后的3个未分配分片呢?需要进一步定位:
GET _cluster/allocation/explain?filter_path=index,shard,primary,current_state,unassigned_info.reason,allocate_explanation{
"index": "log_firewall-2026.05.11",
"shard": 0,
"primary": true,
"current_state": "unassigned",
"unassigned_info": {
"reason": "ALLOCATION_FAILED"
},
"allocate_explanation": "cannot allocate because allocation is not permitted to any of the nodes that hold an in-sync shard copy"
}可以看到罪魁祸首是 log_firewall-2026.05.11:
- “reason”: “ALLOCATION_FAILED” 说明这个主分片在落盘时发生异常情况导致失败了。
- “allocate_explanation”: “…not permitted to any of the nodes that hold an in-sync shard copy”:说明5月11日的这个主分片因为某种原因被拒绝分配了,有可能是超磁盘水位线导致。
但是具体原因目前分析不到,现在最主要的是如何处理异常这个异常分片,让集群恢复正常。
根据opensearch官网cluster api 文档,若部分分片因之前的故障无法完成分配,可重新尝试分片分配操作:
POST /_cluster/reroute?retry_failed=true执行成功后,可以看到集群恢复健康
{
  "cluster_name": "cluster",
  "status": "green",
  "timed_out": false,
  "number_of_nodes": 6,
  "number_of_data_nodes": 6,
  "discovered_master": true,
  "discovered_cluster_manager": true,
  "active_primary_shards": 1156,
  "active_shards": 2352,
  "relocating_shards": 1,
  "initializing_shards": 0,
  "unassigned_shards": 0,
  "delayed_unassigned_shards": 0,
  "number_of_pending_tasks": 0,
  "number_of_in_flight_fetch": 0,
  "task_max_waiting_in_queue_millis": 0,
  "active_shards_percent_as_number": 100
}
四、通过解除底层限速,极速缩短故障恢复窗口 -可选#
故障恢复方案中我们临时提升了磁盘水位线,同时手动迁移历史索引从hot迁往warm节点,但是接下来分片排队同步与迁移过程是比较漫长的。
在默认情况下,OpenSearch 为了防止恢复流量大范围挤占集群的网络带宽和磁盘 I/O、导致前台业务瘫痪,其底层的并发控制和带宽限制是非常保守的。 这就导致即使空间充足,上百个未分配分片(unassigned_shards)可能也需要数小时才能完成同步。
如果此时正处于业务低谷期(如深夜),或评估后确认短时间的 I/O 飙升不会对前台日志摄入和核心安全检索造成影响,我们可以采取“暴力加速”策略,直接提升或者解除软件层面的限制,向硬件的物理极限索要速度。
通过在 Dev Tools 中执行以下高级配置,我们可以将故障恢复的时间窗口从几小时压缩至数分钟内:
PUT _cluster/settings
{
  "transient": {
    "cluster.routing.allocation.node_concurrent_incoming_recoveries": 30,
    "cluster.routing.allocation.node_concurrent_outgoing_recoveries": 30,
    "cluster.routing.allocation.node_concurrent_recoveries": 30,
    "indices.recovery.max_bytes_per_sec": "1gb"
  }
}-
cluster.routing.allocation.node_concurrent_recoveries: 30
- 参数含义:节点级分片恢复全局并发上限。
- 底层机理:它是控制一个节点上同时进行的分片恢复(包括副本初始化、冷热下沉迁移)物理通道的总闸。默认值通常为 2。我们将其抬高到 30,这意味集群多台节点将同时开启庞大的并行计算流,成批次地处理未分配分片,彻底解决排队卡顿。
-
cluster.routing.allocation.node_concurrent_incoming_recoveries: 30
- 参数含义:节点级入向(Incoming)分片恢复并发上限。
- 底层机理:专门限制当前节点作为“接收方”时,允许同时从其他节点流进的分片数量。
-
cluster.routing.allocation.node_concurrent_outgoing_recoveries: 30
- 参数含义:节点级出向(Outgoing)分片恢复并发上限。
- 底层机理:专门限制当前节点作为“提供方(源头)”时,允许同时向外发送的分片数量。
-
indices.recovery.max_bytes_per_sec: “1gb”
- 参数含义:单节点分片恢复的最大网络/磁盘带宽限制。
- 底层机理:即使你开了 30 个通道,如果带宽限死在默认的几十兆,速度依然上不去。我们将其直接拉高到 1gb(1GB/s,相当于直接撑满 10Gbps 万兆网卡)。这彻底消除了系统软件层面的限速,让分片数据在节点间传递时,只受限于底层的物理网卡吞吐与 SSD/HDD 的线速度极限。
重要安全提示
这剂“猛药”是双刃剑。 当带宽拉满到 1GB/s 且并发开到 30 时,集群内部的节点网络互传和磁盘读写开销会瞬间冲顶,可能会产生短时的 IO Wait 飙升。 因此,当观察到 unassigned_shards 归零、集群彻底回绿(GREEN)后,必须第一时间执行 null 复位命令,撤销这些临时特权,让集群回归到日常抗高并发日志写入的稳健状态:
PUT _cluster/settings
{
  "transient": {
    "cluster.routing.allocation.node_concurrent_incoming_recoveries": null,
    "cluster.routing.allocation.node_concurrent_outgoing_recoveries": null,
    "cluster.routing.allocation.node_concurrent_recoveries": null,
    "indices.recovery.max_bytes_per_sec": null
  }
}四、经验总结与整改措施#
在这场与磁盘风暴的赛跑中,虽然我们依靠高级 API 成功实施了在线精准抢救,但暴露出的底层架构设计与容量管理问题同样值得反思。安全日志(SIEM)天然具有写入量大、突发性强、合规留存周期长的特点,为了彻底避免同类故障再次发生,必须从“被动消防”转向“主动防御”。
4.1 适当提高水位线阈值,提高SSD存储利用率#
PUT _cluster/settings
{
  "persistent": {
    "cluster.routing.allocation.disk.watermark.low": "90%",
    "cluster.routing.allocation.disk.watermark.high": "95%",
    "cluster.routing.allocation.disk.watermark.flood_stage": "98%"
  }
}
4.2 构建 Prometheus + Grafana 阶梯式告警指标#
目前依赖人工执行 _cluster/health 发现红色为时已晚。必须利用 Fluent Bit/Prometheus 采集集群指标,在 Grafana 中建立多级水位线预警:
监控指标,告警阈值,级别,触发动作 Hot Node Disk Pct,85%,Warning,钉钉/企业微信/邮件通知,运维团队开始介入容量审计 Hot Node Disk Pct,90%,Critical,钉钉/企业微信/邮件通知,运维团队开始介入紧急处理故障 Cluster Unassigned Shards,> 0,Warning,持续 5 分钟未归零,立即触发告警,防止分片暗中挂起
- Prometheus 告警规则参考配置
groups:
  - name: opensearch_capacity_and_health_alerts
    rules:
      # 1. Hot 节点磁盘占用率达到 85%(Warning)
      - alert: OpenSearchHotNodeDiskSpaceWarning
        expr: (opensearch_fs_path_total_bytes{node=~".*-hot.*"} - opensearch_fs_path_available_bytes{node=~".*-hot.*"}) / opensearch_fs_path_total_bytes{node=~".*-hot.*"} * 100 >= 85
        for: 5m
        labels:
          severity: warning
          cluster: cluster
        annotations:
          summary: "OpenSearch hot 节点磁盘空间吃紧 (85%)"
          description: "集群 {{ $labels.cluster }} 中的 Data 节点 {{ $labels.node }} 磁盘占用率已达到 {{ $value | printf \"%.2f\" }}%。请立即介入进行容量审计!"

      # 2. Hot 节点磁盘占用率达到 90%(Critical)
      - alert: OpenSearchHotNodeDiskSpaceCritical
        expr: (opensearch_fs_path_total_bytes{node=~".*-hot.*"} - opensearch_fs_path_available_bytes{node=~".*-hot.*"}) / opensearch_fs_path_total_bytes{node=~".*-hot.*"} * 100 >= 90
        for: 2m
        labels:
          severity: critical
          cluster: cluster
        annotations:
          summary: "OpenSearch hot 节点磁盘空间极度危险 (90%)"
          description: "集群 {{ $labels.cluster }} 中的 Data 节点 {{ $labels.node }} 磁盘占用率已飙升至 {{ $value | printf \"%.2f\" }}%!即将触及 95% 高水位红线,运维团队需紧急处理,准备启动 Logstash 背压限流!"

      # 3. 单个集群未分配分片总数大于 0 持续 5 分钟(Warning)—— 基于 cluster 标签按集群统计
      - alert: OpenSearchClusterUnassignedShardsDetected
        expr: sum by (cluster) (opensearch_cluster_shards_number{type="unassigned"}) > 0
        for: 5m
        labels:
          severity: warning
        annotations:
          summary: "OpenSearch 集群存在未分配分片"
          description: "OpenSearch 业务告警:检测到集群 [{{ $labels.cluster }}] 整体存在 {{ $value }} 个未分配分片(Unassigned Shards),且已持续 5 分钟未归零!请立即前往该集群执行 `_cluster/allocation/explain` 审查分片状态。"